
Monitoring
The Charmed Distribution of Kubernetes® includes the standard Kubernetes dashboard for monitoring your cluster. However, it is often advisable to have a monitoring solution which will run whether the cluster itself is running or not. It may also be useful to integrate monitoring into existing setups.
Prometheus is the recommended way to monitor your deployment - instructions are provided below. There are also instructions for setting up other monitoring solutions, or connecting to existing monitoring setups.
Monitoring with Prometheus
The recommended way to monitor your cluster is to use a combination of Prometheus, Grafana and Telegraf. The fastest, easiest way to install and configure this is via conjure-up when installing the Charmed Distribution of Kubernetes®, by selecting the box next to Prometheus from the Add-on menu. You can then log in to the dashboard as described below. See the quickstart guide for more details on installing CDK with conjure-up.
If you have already installed your cluster, you will be able to add and configure the extra applications using Juju as described here:
Install the required applications
The following commands will add the required applications:
# Note: the prometheus2 charm is deployed as 'prometheus'
juju deploy prometheus2 --series=bionic --constraints "mem=4G root-disk=16G" prometheus
juju deploy grafana --series=bionic
juju deploy telegraf --series=bionic
juju expose grafana
Add relations
Relationships need to be established between the applications and the units running the cluster:
juju add-relation prometheus:grafana-source grafana:grafana-source
juju add-relation telegraf:prometheus-client prometheus:target
juju add-relation kubernetes-master:juju-info telegraf:juju-info
juju add-relation kubernetes-worker:juju-info telegraf:juju-info
Adding a scraper for Prometheus
Prometheus will also need an appropriate scraper to collect metrics relevant to the cluster. A useful default is installed when using conjure-up (the template for this can be downloaded here), but you can also configure it manually by following the steps outlined here:
1. Download the scraper file
curl -O https://raw.githubusercontent.com/conjure-up/spells/master/charmed-kubernetes/addons/prometheus/steps/01_install-prometheus/prometheus-scrape-k8s.yaml
This is the template, but it needs some specific information for your cluster.
2. Get the relevant address and password
api=$(juju run  --unit kubeapi-load-balancer/0 'network-get website --format yaml --ingress-address' | head -1)
pass=$(juju run --unit kubernetes-master/0 'grep "password:" /home/ubuntu/config' | awk '{ print $2 }')
This will fetch the relevant info from your cluster and store in temporary environment variables for convenience.
4. Substitute in the variables
sed -e 's/K8S_PASSWORD/'"$pass"'/' -e 's/K8S_API_ENDPOINT/'"$api"'/' <prometheus-scrape-k8s.yaml > myscraper.yaml
5. Configure Prometheus to use this scraper
juju config prometheus scrape-jobs="$(<myscraper.yaml)"
Add the dashboards
As with the scraper, there is a sample dashboard available for download here. You can download and configure grafana to use it by following these steps:
1. Download the sample dashboard configuration
curl -O https://raw.githubusercontent.com/conjure-up/spells/master/charmed-kubernetes/addons/prometheus/steps/01_install-prometheus/grafana-k8s.json
2. Upload this to grafana
juju run-action --wait grafana/0 import-dashboard dashboard="$(base64 grafana-k8s.json)"
There is also a default Telegraf dashboard. If you wish to install this, it can be done in a similar way:
curl -O https://raw.githubusercontent.com/conjure-up/spells/master/charmed-kubernetes/addons/prometheus/steps/01_install-prometheus/grafana-telegraf.json
juju run-action --wait grafana/0 import-dashboard  dashboard="$(base64 grafana-telegraf.json)"
Retrieve credentials and login
To open the dashboard in your browser you will need to know the IP address for grafana and the admin password. These can be retrieved with the following commands:
juju status --format yaml grafana/0 | grep public-address
Will return the accessible IP address for the dashboard.
juju run-action --wait grafana/0 get-admin-password
Will return the password for the user ‘admin’
You can now navigate to the website at http://<your-ip>:3000 and login with the username admin and the password you just retrieved.
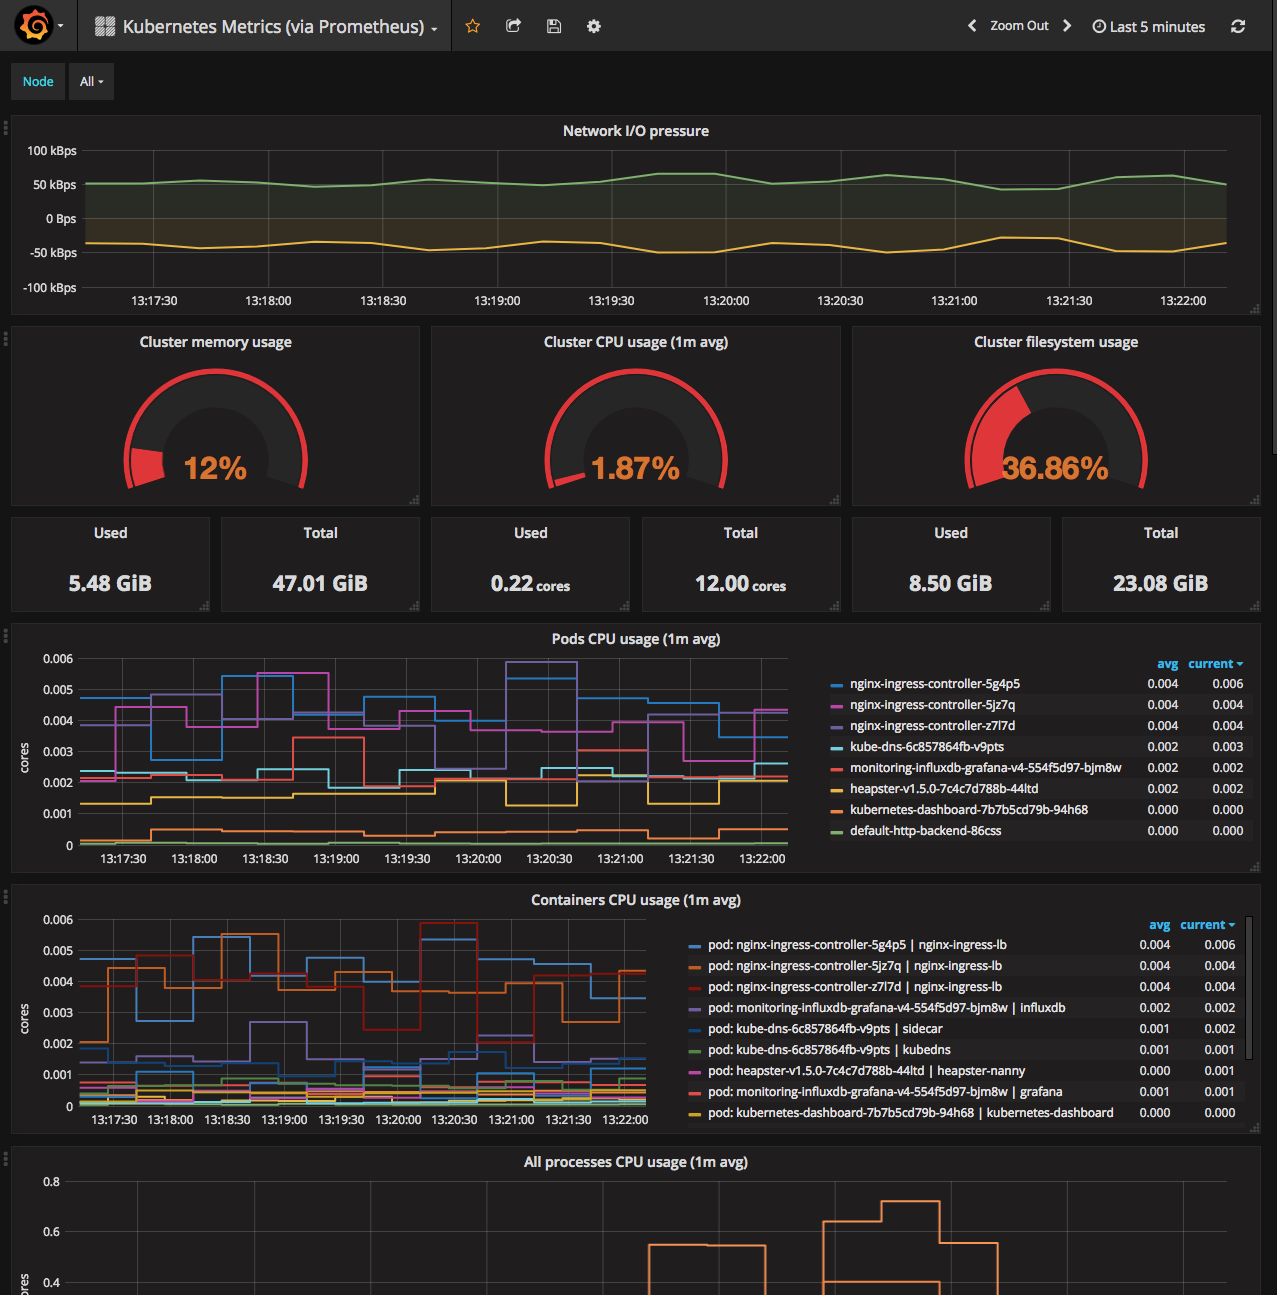
Once logged in, check out the cluster metric dashboard by clicking the Home drop-down box and selecting Kubernetes Metrics (via Prometheus):
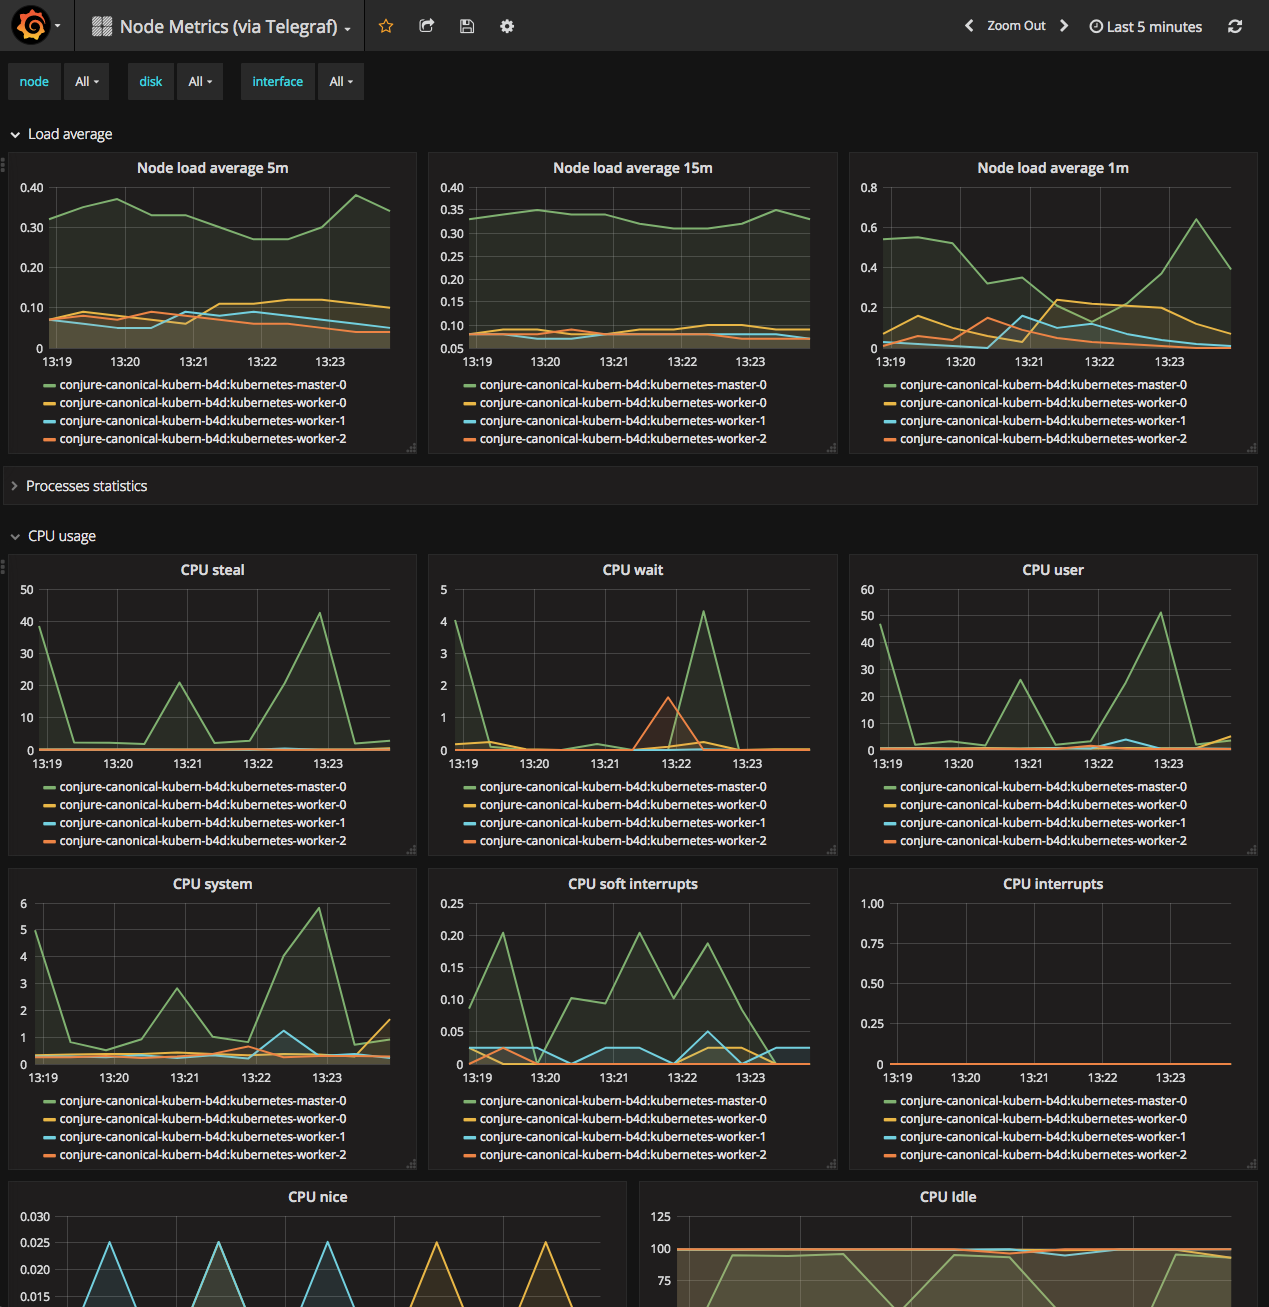
You can also check out the system metrics of the cluster by switching the drop-down box to `Node Metrics (via Telegraf):
Monitoring with Nagios
Nagios (https://www.nagios.org/) is widely used for monitoring networks, servers and applications. Using the Nagios Remote Plugin Executor (NRPE) on each node, it can monitor your cluster with machine-level detail.
To start, deploy the latest version of the Nagios and NRPE Juju charms:
juju deploy nagios --series=bionic
juju deploy nrpe --series=bionic
juju expose nagios
Connect Nagios to NRPE:
juju add-relation nagios nrpe
Now add relations to NRPE for all the applications you wish to monitor, for example kubernetes-master, kubernetes-worker, etcd, easyrsa, and kubeapi-load-balancer.
juju add-relation nrpe kubernetes-master
juju add-relation nrpe kubernetes-worker
juju add-relation nrpe etcd
juju add-relation nrpe easyrsa
juju add-relation nrpe kubeapi-load-balancer
To connect to the Nagios server, you will need its IP address:
juju status --format yaml nagios/0 | grep public-address
The default username is nagiosadmin. The password is randomly generated at install time, and can be retrieved by running:
juju ssh nagios/0 sudo cat /var/lib/juju/nagios.passwd
![nagios dashboard image][https://assets.ubuntu.com/v1/4b109895-cdk-nagios.png]
Using an existing Nagios service
If you already have an existing Nagios installation, the nrpe charm can be configured to work with it.
juju config nrpe export_nagios_definitions=true
juju config nrpe nagios_master=<ip-address-of-nagios>
See the External Nagios section of the NRPE charm readme for more information.
Monitoring with Elasticsearch
Elasticsearch (https://www.elastic.co/) is a popular monitoring application which can be used in conjunction with CDK.
Deploy the required applications
Use Juju to deploy the required applications:
juju deploy elasticsearch --series=bionic --constraints "mem=4G root-disk=16G"
juju deploy filebeat --series=bionic
juju deploy kibana --series=xenial
juju expose kibana
Add relations
You now need to relate the elasticsearch applications together, and connect the filebeat application to the applications you want to monitor:
juju add-relation elasticsearch kibana
juju add-relation elasticsearch filebeat

juju add-relation filebeat kubernetes-master
juju add-relation filebeat kubernetes-worker
juju add-relation filebeat kubeapi-load-balancer
juju add-relation filebeat etcd
Initialise the dashboard
A sample dashboard is included in kibana for monitoring the beat services. You can deploy it by running the following:
juju run-action --wait kibana/0 load-dashboard dashboard=beats
You can find the dashboard at the public IP address of your kibana application
juju status kibana --format yaml| grep public-address